


11 Dec Bat Acoustic Data Analysis: My Favorite Part
Hello readers,
This will come as no surprise to those who know me (AKA 90% of my readers) but I love graphs. Getting deep into the data analysis process is thrilling and something I have been waiting for all summer. For those of you who read my last blog you know thar this summer I did stationary and mobile bat acoustic surveys around city parks in Minneapolis, Minnesota. Below are the results of my surveys this summer. Let’s investigate what we can learn from this data.
Just in case you’re curious this is what the bat call files look like. One wave is also called a pulse and numerous pulses make up one call file. Like I mentioned in my last blog, I used a program (Kaleidoscope Pro) to automatically identify each call file as either a bat species or other (noise). This process can take a while, but the output is insane. The program outputs excel sheets which details the components of every sound file. It lists the top three species it believes the file to be as well as any information you would need to further vet the calls yourself. While this is useful information it is nowhere near as cool as the visual output. The program shows the bat calls on a spectrogram which maps the amplitude of sound at different frequencies over time.
After looking at hundreds(thousands) of spectrograms over the past few weeks I can say that I do notice a difference between species calls…sometimes. There is enough overlap between species call frequencies and shape to be confusing, but it is super interesting to try. I will attach plenty of spectrograms to see if you too can see the difference! I watched about 15 different tutorials on using this program and there are still far too many buttons to make sense.
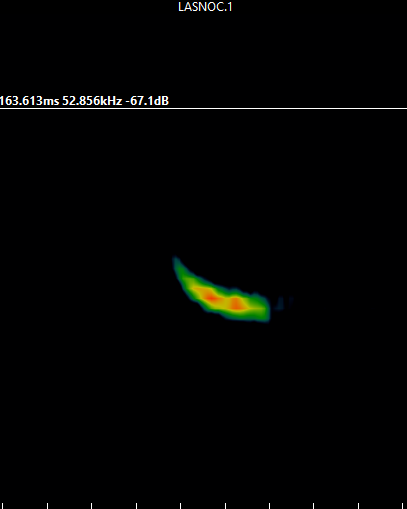
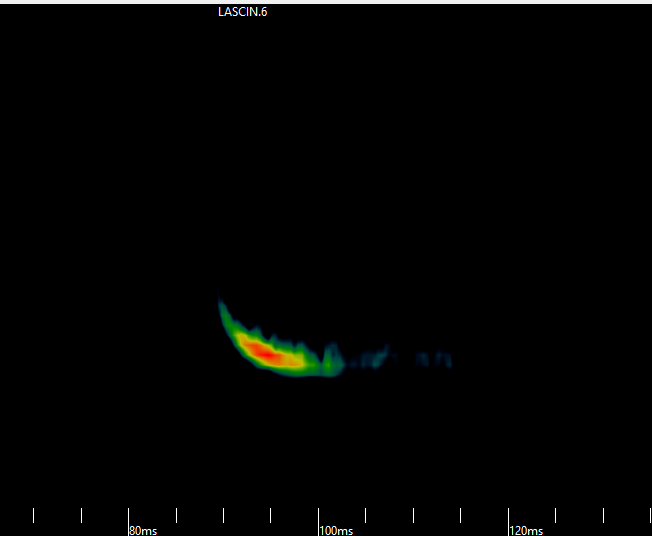
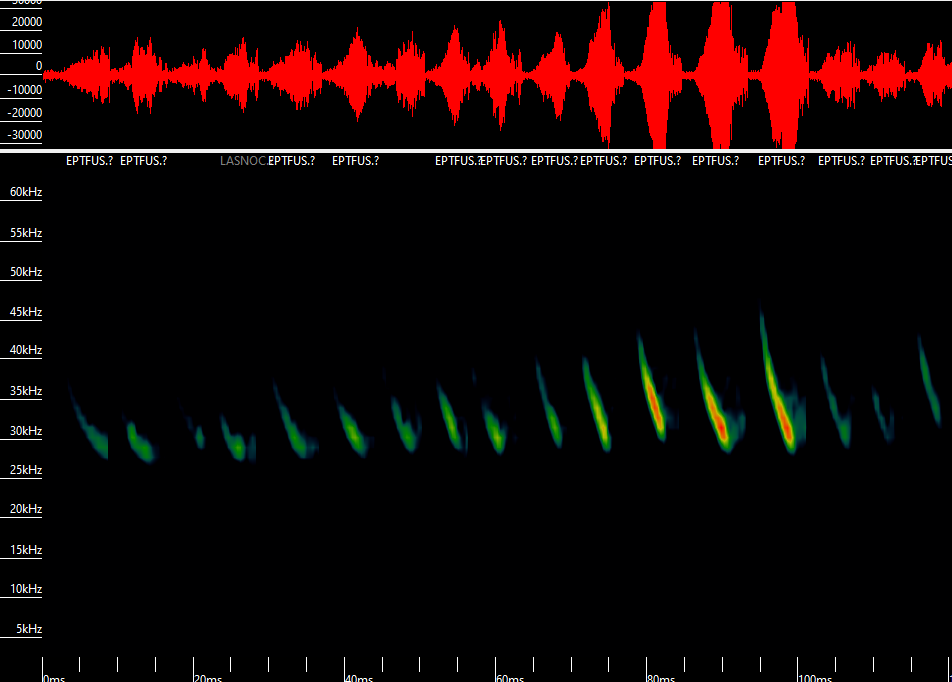
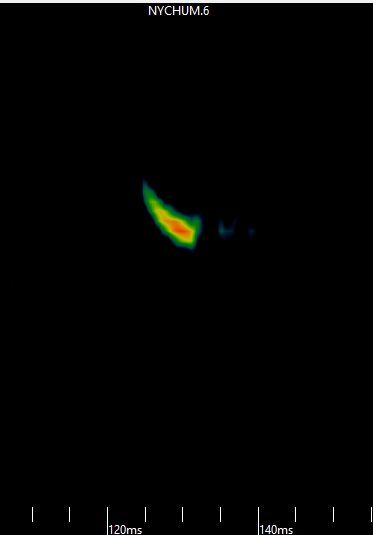
A few examples of what the bat calls can look like in the program. The program identified each of these as a different species of bat indicated by the code at the top.
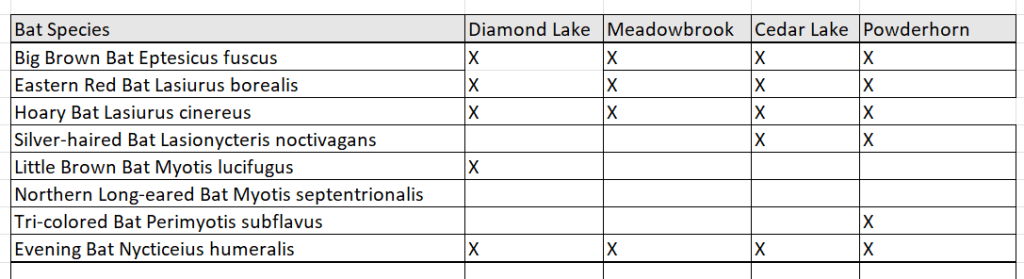
I also want to talk about a summary of my findings. Like I mentioned in my last blog we detected 7/8 bat species in our survey. The only one we missed was the elusive Northern long-eared bat which is federally listed as endangered. Other than that, we have all other species recorded, including loads of big brown and hoary bat calls. Some exciting news is we also detected tricolored bats in a new area! Tricolor bats (Perimyotis subflavus) are proposed to be federally listed as endangered under the Endangered Species Act so it’s great to see signs of them being in different areas. It was interesting to compare the species detected by the mobile route as we are getting additional location data outside of our stationary sites. I will link my stationery and mobile species makeup graphs below.
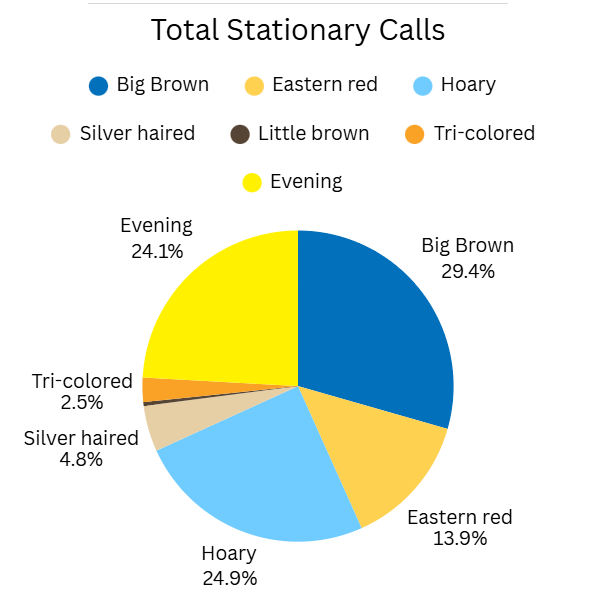
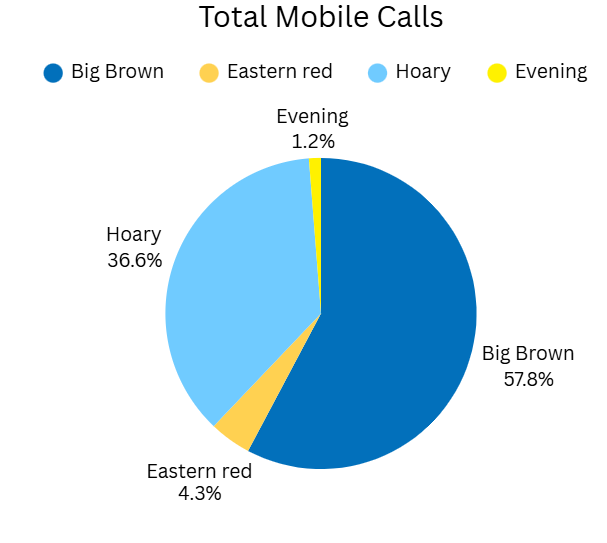
Why we found which species where is still a work in progress for me to understand. Data patterns could be analyzed for weeks but since this is my last few days I just have to pick out the big messages from the data.
1) Four bat species (big brown, evening, hoary, and eastern red) were found along the mobile route and at all stationary sites. These have across the board been the common species for years.
2)The most bat calls were recorded at the two sites that overlooked a water source. This makes sense as bats swoop down for water throughout the night, which at two sites is right in front of the microphone.
3) More bat calls were recorded in June than July. This is interesting as the bat pups of this season were on track to be volant by our July recordings.
Like I said, I could spend lots of time with this data but the above points are what my summer of surveys boils down to. I hope you enjoyed the deep dive, I know I sure did.
Thanks for reading!
Grace
Sorry, the comment form is closed at this time.